
More testing on the bike
summary of tests on the bike

Winter. This means a lot of indoor training. It is an opportunity to get better at cycling.
If we want to improve physically, emotionally, or financially, the first thing to do is find out where we are at the moment. This is called baseline data. It helps us create a roadmap.
In the last episode of The MAD Science Meets Real Life, Iñaki and Alan used a good analogy: “All roads lead to Rome, but there are better ways to get there. First find out where you are, then map out the road, know which cities you will be visiting on the way…”
The test I am writing about today is that baseline — finding out where we are.
We will be doing more tests in the future. That helps us understand how I am progressing (if any). The follow-up tests can be compared to the cities along the way to Rome.
In one of the previous posts, I described how we did the SubMax test to find Lactate Threshold 1 (LT1).
This time we did the following tests:
Full profile test
5-minute ramp test
2×20-minute test
P-max test (the maximum power I could sustain for 3 minutes)
The goal of the full profile test is to find out where my heart rate and power output lie at Lactate Threshold 1 (LT1) and Lactate Threshold 2 (LT2).
Here are the test results:
The full profile protocol
On test day it was –7 °C outside, and I have my bike set up in an unheated garage, so it was maybe –5 °C. In the cold, the lactate meter behaves a bit strangely — this is something to keep in mind. I had to remove and reinsert the battery to restart it, so instead of one minute between intervals it was more like 2–3 minutes. I still managed to get decent data and usable data. I was satisfied.
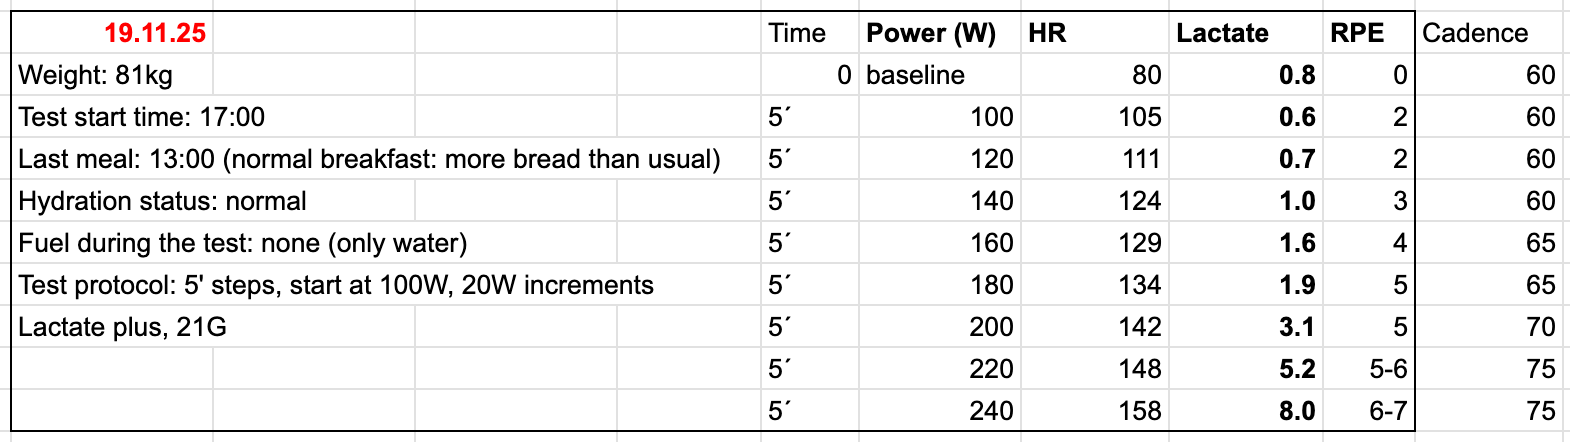
One thing I was not so satisfied with was my average HR for each power increment. It was much slower than I expected. I assumed that was because I took 2–3 minutes of rest to measure lactate, so my heart rate dropped. Then I also assumed that if I did a continuous ramp test, my HR would be different.
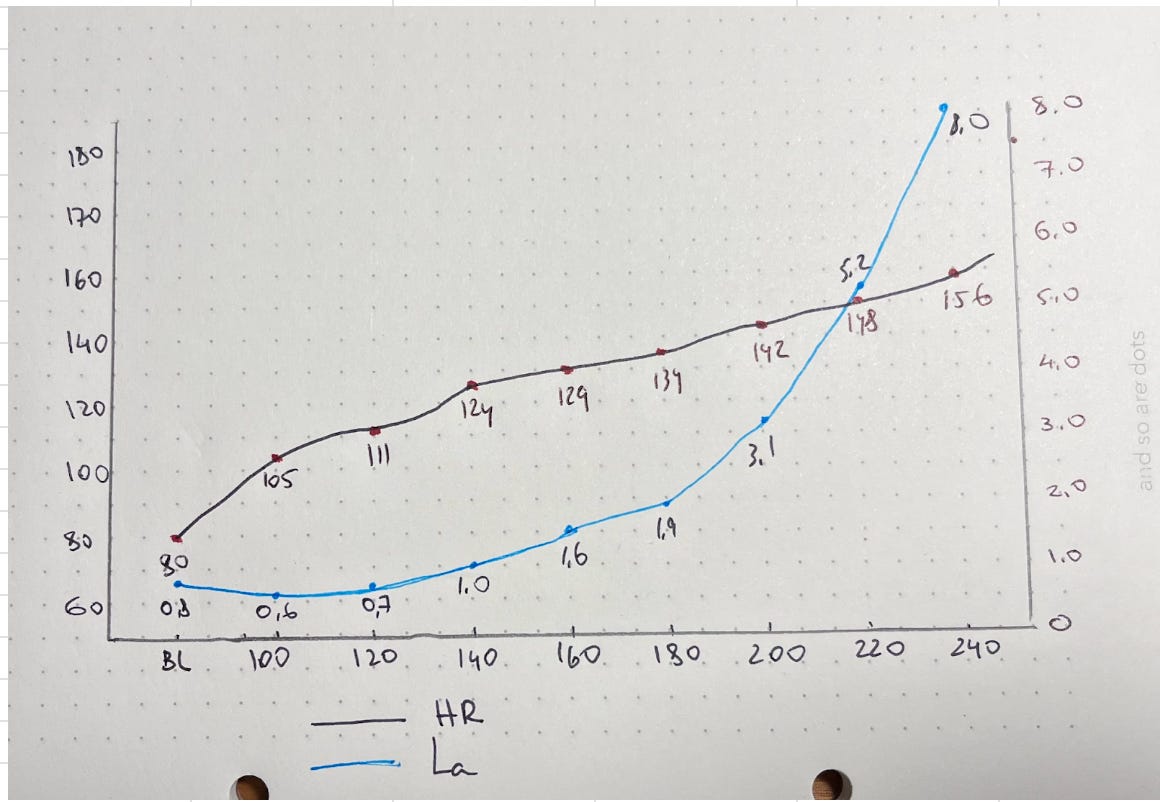
That is exactly what I did two days later, and here is what it showed:
I was wrong. Average HR didn’t change for a given power output despite the rest periods in the previous test. So, my conclusion was “HR vs Watt” is more or less stable.
Power = torque × cadence
Speed correlates with power. In order to generate a high power one should have a higer torque. If we combine a high torque with high cadence then we end up with higher power.
I didn’t know how to work at a higher cadence. My usual cadence is around 60–65 rpm, and I didn’t know that was a low cadence. I am learning every day.
So Gordo assigned a test session with 2×20 minutes at 85 rpm. It felt a bit weird, but I somehow managed to do it. I guess it is a muscle skill to develop, and it gets better with time — as it usually does.
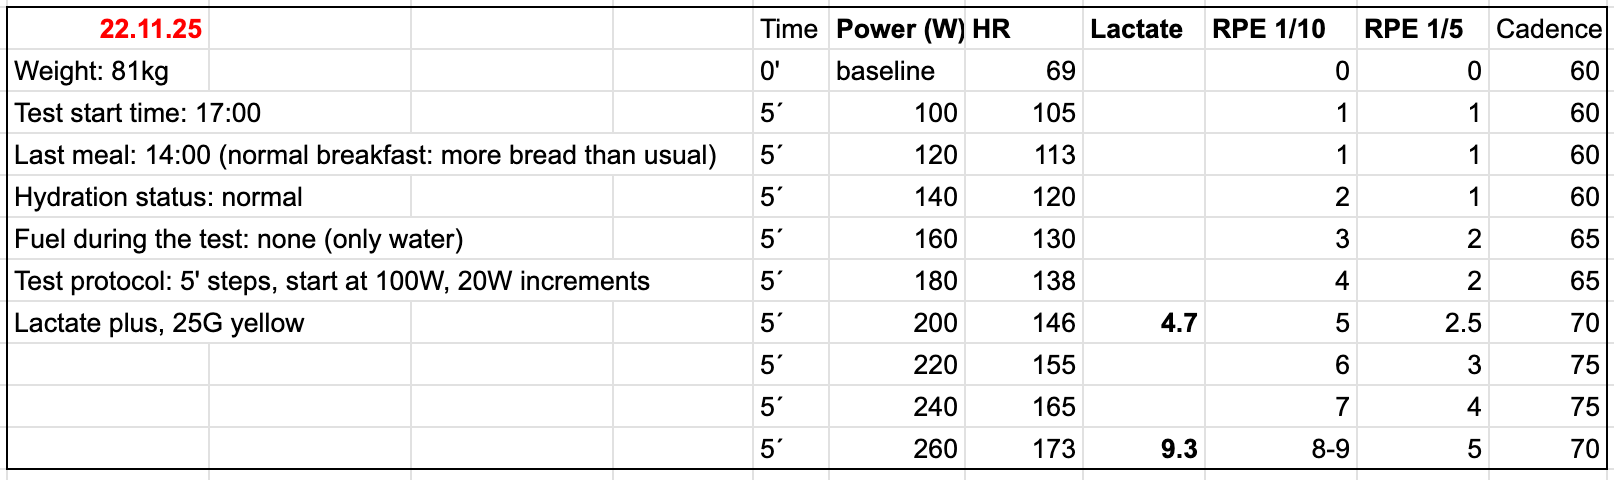
The result of the 2x20 @85 rpm test
For a few weeks ago, Gordo told me to keep my easy rides capped at 140 bpm, which corresponds to LT1. Some days I felt that 140 bpm was heavier, so I thought my LT1 was probably around 130 bpm. I asked Gordo if I should go down to 130 bpm. He asked me to measure lactate during the 2×20 session to find it out. So, I did.
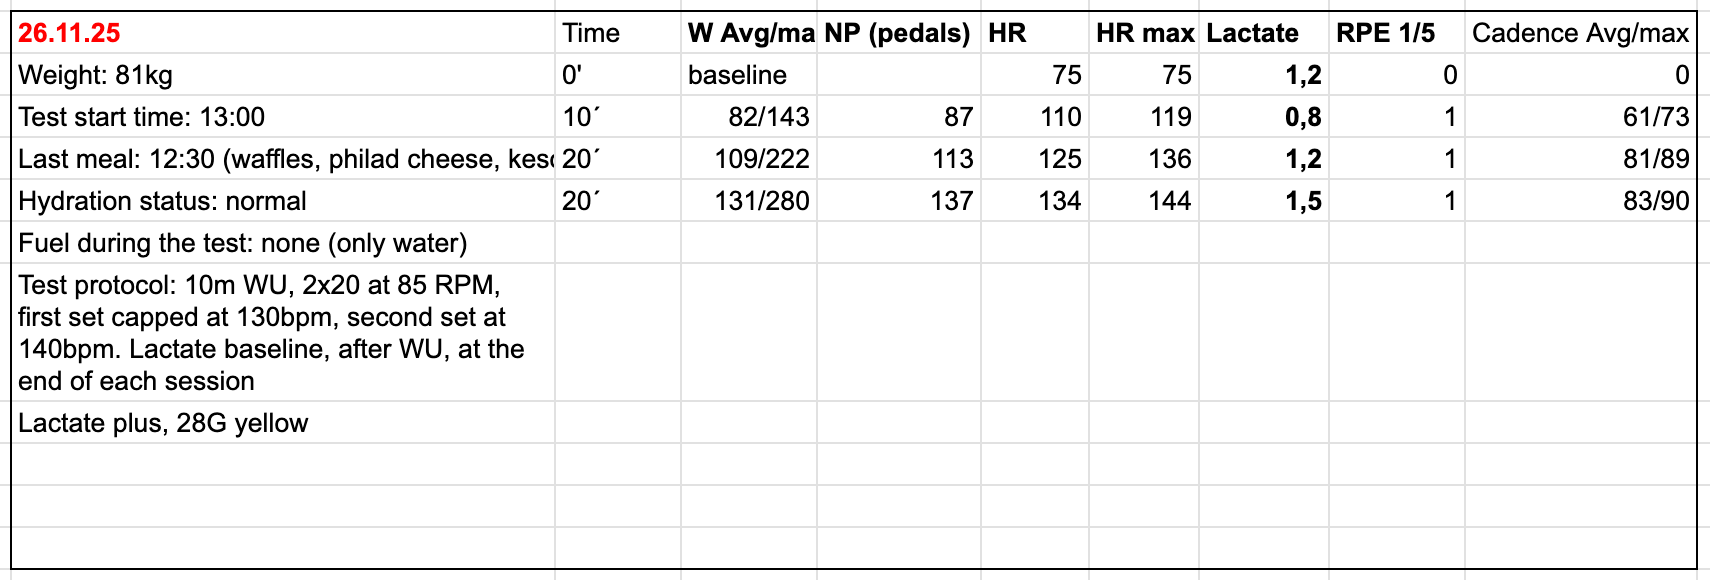
I was wrong, and Gordo was right. When I capped my HR at 140 bpm, lactate was actually lower than at LT1. So for now we will keep LT1 at 140 bpm.
The next was the P-max test. It tests the maximum power for a given period of time.
The test protocol:
1. Baseline lactate
2. Warm-up - 30 min
3. Rest - 5 min
4. Lactate
5. Main test: start at 40W, 3 min steps, 40W increments until exhaustion
6. Lactate after 1 min, 2 min and 20 min
Here are the test results
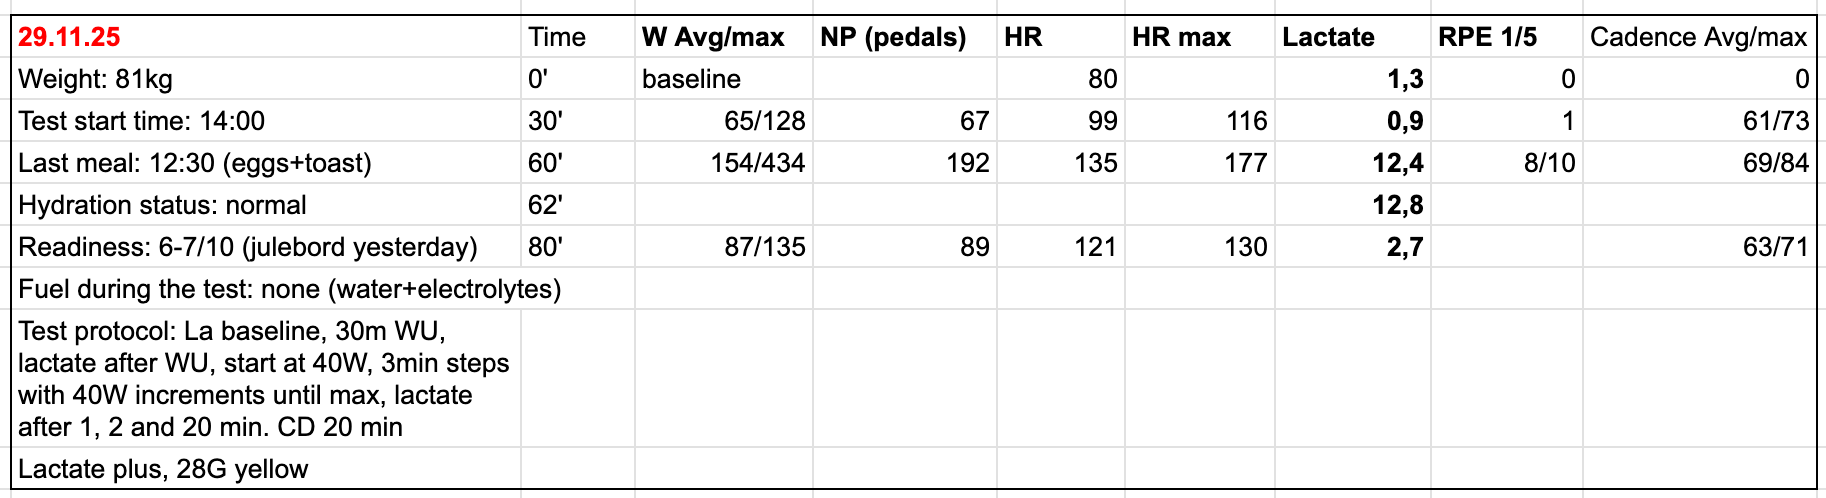
I started at 40W and could go up to 320W. Even though I got decent data today, I am left dissatisfied how the test went. The power output was not stable during the steps. I couldn’t keep the power stable. So, I can’t say what my exact max power is. I assume it is around 300W for 3 min. Another point is RPE. From VO2max tests, I know how 10/10 feels. Today, I was maybe 8/10, but somehow couldn’t keep 320W stable. (Gordo warned about this 😊 )
I will redo the test in the near future. After this test, Zwift upgraded my FTP from 213 to 219W which is nice feeling.
After the tests we performed, I see really good opportunities for improvement. These are not the numbers I would be satisfied with, but I think it is a good starting point.
Lessons learned during the tests
- cold has a big impact on the lactate meter
- use lower gauge (21G) in sub-zero temperature, and use a higher gauge (25G) if > 0°C
- ask questions, have assumptions, and test to find answers
- feeling (RPE) is very important
- being dissatisfied is totally fine
- understand what you are doing and why you are doing it.
Questions I am left with
- why is there a big difference between my Run HRmax (200) and Bike HRmax (177)?
- what should I do to bridge the gap? or should I bridge the gap?
- is there a specific plan focusing the bike? or should we keep the low zone focus?
- is there any specific strength training exercises for the bike?
- how do I know that I am not wasting any watts? (efficiency)
- what are the main/frequent injuries and what to watch for?
We keep learning, and informing you.
Stay healthy,
Bek
Hi Bek,
You said you got serious about exercise at 31.
Do you ever wish you'd started earlier, or do you think starting later was actually perfect timing for you?
Bike heart rate should be 10% lower than run heart rate because of body position: you are not vertical so your heart doesn’t have to pump as hard. You also are using far fewer muscles. That said 177 seems a bit too low. With more fitness this should get closer to run max